Water Network for Local Growers
Summary
AGRIS Co-operative Ltd in collaboration with Weather INnovations Consulting LP (WIN) have a network of 80 automated monitoring sites across southwestern Ontario, 15 at each AGRIS Co-operative, Wanstead Farmers Co-operative Ltd and Haggerty Creek Ltd branch and 65 at participating grower locations. In addition to the automated stations, 75 manual CoCoRaHS rain gauges were installed at grower locations that are reported in every morning. The 80 automated weather station network is the basis of a customized AGGrower Daily Dashboard that was designed to display live weather as well as host site-specific crop models that are of importance to AGRIS Co-op, Wanstead Farmers Co-op and Haggerty Creek growers in southwestern Ontario. Site-specific models include: SPRAYcast®, corn and soybean growth stage models, corn drydown, TOMcast™, DONcast®, Soil Water Balance and in 2017 a corn nitrogen model as well as 4R calculator. Each grower that signs up can register their fields and will have access to the appropriate model for their registered crop. The weather network is used to enable the models to be site-specific and tailored to each individual grower.
Challenge
There are many precision agriculture platforms on the market today but many do not incorporate weather. AGRIS saw a need for more local content and an opportunity to build a local weather network that would serve their growers as part of their Advanced Information Systems program. The AGGrower Daily Dashboard program provides the weather conditions to fine-tune operational and input decision-making by field or crop following the 4R principles throughout the entire growing season.
Solution
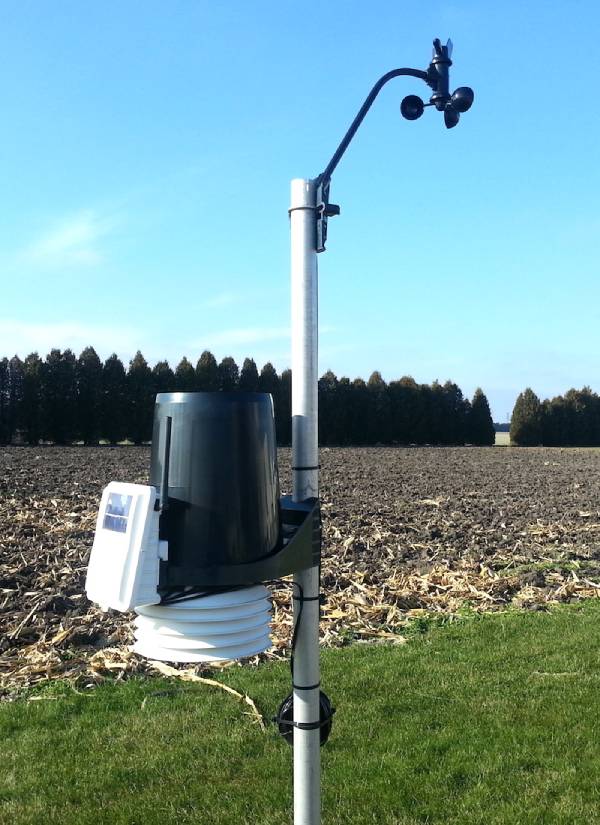
In 2016 WIN installed 80 Davis weather stations and 75 CoCoRaHS rain gauges across southwestern Ontario along with AGRIS’ launch of the AGGrower Daily Dashboard to their customers. The AGGrower Daily Dashboard addresses the need for better and more accurate weather information that will enable growers to enhance their ability to identify, respond quickly and efficiently to climactic events, and ultimately better adapt to and manage day-to-day risk.
Results
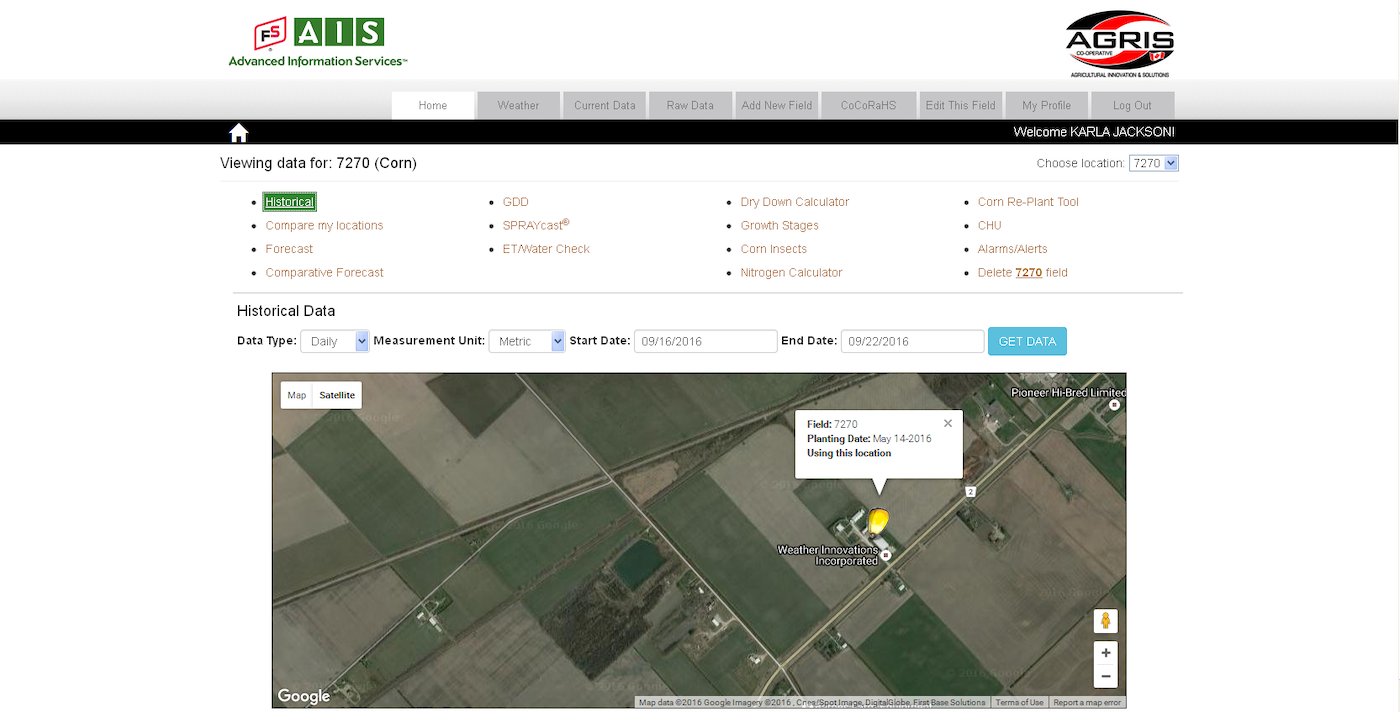
As the weather network and dashboard have been installed and running for as a pilot season in 2016, the AGGrower Daily Dashboard is being ramped up in 2017 for full incorporation into grower operations. As popularity of the dashboard grows, AGRIS is adding grower specific field maps, and aerial imagery to their customized dashboards as well as the beneficial N-Watch model paired with local rainfall data as well as 4R guidelines to help their growers make the right decisions at the right time.
Sustainable Success
As the AGGrower Daily Dashboard is in its first full season of monitoring and modeling after a pilot season in 2016 the program is set to combine existing tools that incorporate the grower’s precision ag data along with the new weather, nitrogen and growth staging models that allow the growers to manage their farm profiles in near real-time. As more and more growers are beginning to adapt different elements of precision ag into their farming, the AGGrower Daily Dashboard is set to incorporate the new advances and adjust to the growers needs. The continued success of the weather network will allow for growers to plan and adapt to variable conditions as well as fine-tune models to be robust in extreme conditions and play an important role in growers’ on-farm decisions.